|
Below are the N-glycan ratings, scored by experimentally determined mass changes and GU shifts.
|
Peak analysis status: |
| Keep? | Score | Oxford notation |
Diagram | Details | More information |
Graphical analysis |
|---|
|
Digestions have no effect on mass and GU but peak area increases or remains the same.
Below are the N-glycan ratings, scored only by delta GU.
|
Peak analysis status: |
| Keep? | Score | Oxford notation |
Diagram | Details | More information |
Graphical analysis |
|---|
|
Score threshold:

|
Include:
|
Peak analysis status: |
|||
|
|
|
|
|
|
|
|
|
|
|
|
|
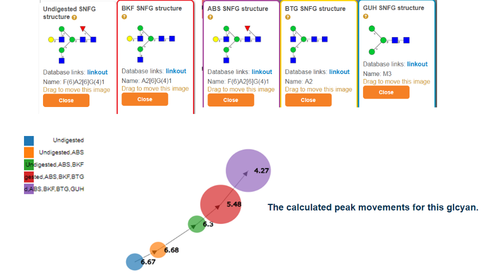
Circles represent a peak in each digestion panel. The size of the circle is proportional to the fluorescence (FLR) peak area (or relative abundance). Often peak areas (circle size) grow as the peak shifts. The number inside the curcle is the GU of the FLR peak. Move the circles to the center of the screen and click on them to display the glycan at the peak.
Tip: If there are more than one directed graph it is because this peak has more that one glycan annotation.
.
The score is the sum of:
|

|
You will be redirected to the Glucose Unit evidence in our database  .
.
Note that Glycan Analyzer will remain open.
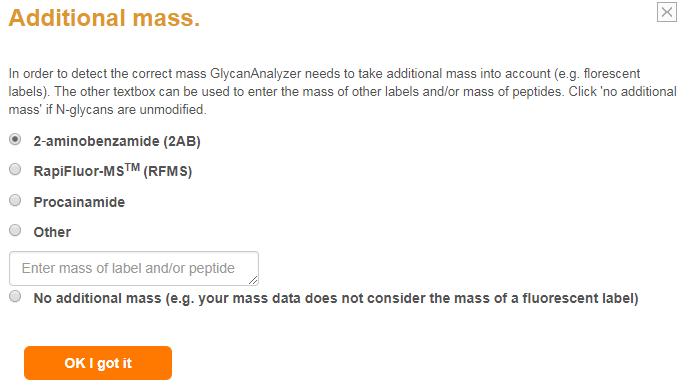
In order to detect the correct mass GlycanAnalyzer needs to take additional mass into account (e.g. florescent labels). The other textbox can be used to enter the mass of other labels and/or mass of peptides. Click 'no additional mass' if N-glycans are unmodified.
In order to detect the correct mass GlycanAnalyzer needs to take additional mass into account (e.g. florescent labels). The other textbox can be used to enter the mass of other labels and/or mass of peptides. Click 'no additional mass' if N-glycans are unmodified.
Software screenshots are marked in grey boxes.
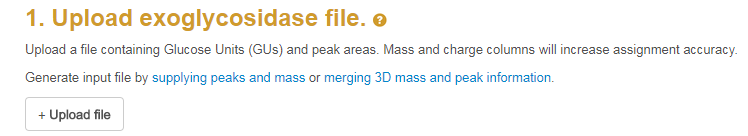
There are three possible input formats to use in GlycanAnalyzer. The files can be easily uploaded by clicking the 'Upload' button. Each of the three file formats can be generated using the two links:
Tutorial 1 has a step by step manual on how to use this input format.
To enter this type of data into the software you need to click the 'merging 3D mass and peak information' link seen in the screenshot below:
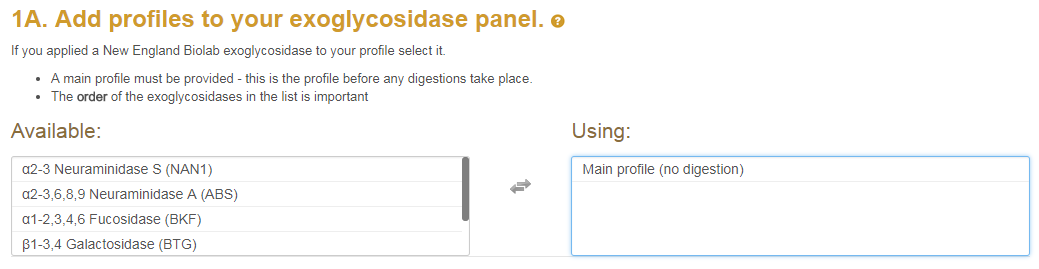
You can add each exoglycosidase to build a panel by selecting each enzyme displayed in the list screenshot below:
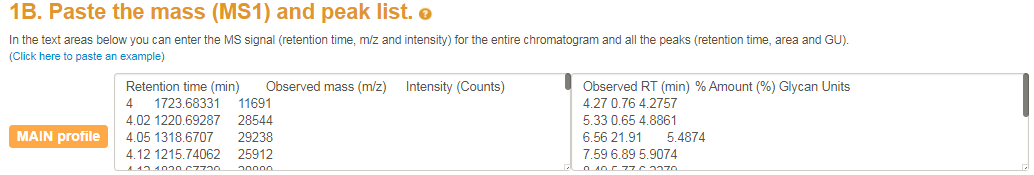
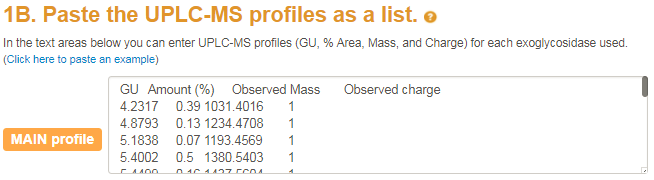
After your exoglycosidase panel is set up you can enter your 3-dimensional mass list and peak list into the text boxes as displayed below. The 3D mass list must contain retention time, observed mass and itensity columns. The peak list must contain Retention time, % amount and the peaks Glycan Units.
Tutorial 2 has a step by step manual on how to use this input format.
To enter this type of data into the software you need to click the 'suppling peaks and mass' link seen in the screenshot below:
After your exoglycosidase panel is set up you can enter your peak list with annotated mass and charge states. The mass and charge were determined by the user. Note that the columns GU, %area, mass and charge should be separated by tabs.
Tutorial 3 has a step by step manual on how to use this input format.
This is identical to Input format 2 (see above) except the 'Observed mass' and 'Observed charge' columns are replaced with 'NA' values (i.e. not available).
Software screenshots are marked in grey boxes.
Your chromatogram is separated into liquid chromatography peaks each marked by a GU and area. Each peak can be selected one-by-one from the 'select peak' drop menu (see image below).
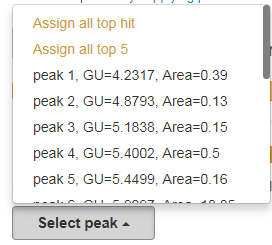
Another option is to assign N-glycans to the entire chromatogram. For this two options are available in the drop menu: 'Assign all top hit' and 'Assign all top 5'. This will return the best ranked N-glycan assignment and the best 5 ranked N-glycan assignment, for all your peaks, respectively.
Software screenshots are marked in grey boxes.
An exoglycosidase panel is an array of exoglycosidases applied in a particular order. Exoglycosidases are enzymes that release monosaccharides from the non-reducing of N-glycans. They not only have specificity toward monosaccharide units but also cleave specific anomeric alpha/beta configurations and glycosidic linkage. Given that the UPLC and MS peaks change in response to exoglycosidase application, it is clear that the sequential application of an array of exoglycosidase will give the necessary information to infer exact structure of any N-glycan.
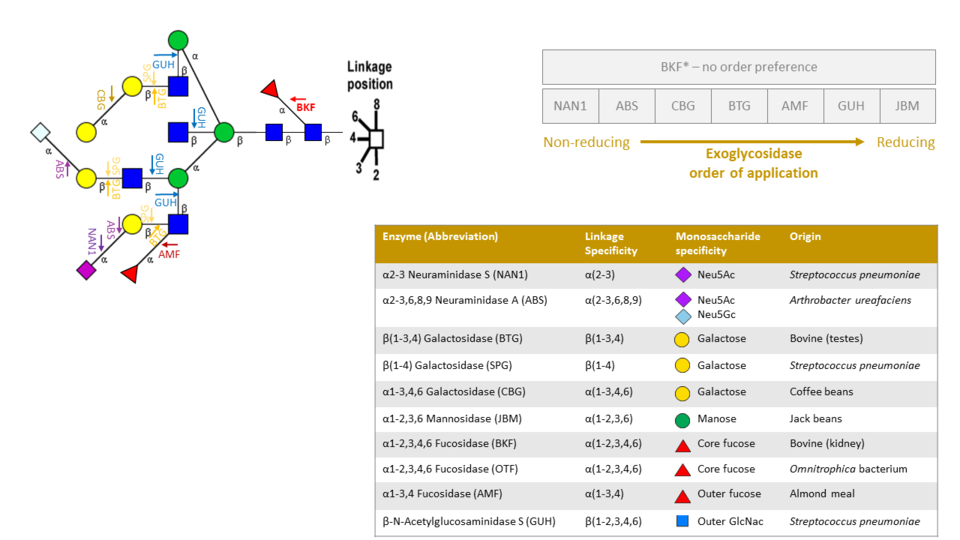
Exoglycosidases cleave monosaccarides from non-reducing end to reducing end. For this reason order of application is important. For example, in the above image applying a BTG enzyme first will not cleave any β galactose until all Neu5ac, Neu5Gc and α galactose are first removed
Software screenshots are marked in grey boxes.
Each exoglycosidase must have its own set of UPLC data and MS1 data. Required is a 'main profile' this is often the undigested profile but it can be any starting profile. The screenshot below shows the available exoglycosidases on the left. The ones you are using are on the right.
Software screenshots are marked in grey boxes.
After your exoglycosidase panel is set up you can enter your 3-dimensional
mass list and peak list into the text boxes as displayed below.
The screenshot below shows the textfields where the user can enter the MS1 and UPLC data.
The left textfield allows the users to enter the 3D mass list (i.e. the MS1).
The 3D mass list must contain retention time, observed mass and itensity columns.
In the right textfield the user can enter the peak list.
The peak list must contain Retention time, % amount and the peaks Glycan Units.
Note that all columns should be separated by tabs (i.e. the tab  button on your keyboard).
Software screenshots are marked in grey boxes.
After your exoglycosidase panel is built you can enter your peak list
with annotated mass and charge states.
A single textfield will appear where the user can enter the UPLC peaks (defined by GU and % area)
and the extracted MS1 data (defined by mass and charge).
The mass and charge were determined by the user from the mass spectra but these can be ignored by suppliying the 'NA' token.
Note that the columns GU, %area, mass and charge should be separated by tabs (i.e. the tab button on your keyboard).
Software screenshots are marked in grey boxes.
N-glycans are commonly labelled with a fluorescent molecule which allows fluorescence-based quantitation after chromatographic separation.
Using fluorescent labels adds the mass of the labelling molecule to the MS1 therefore users should indicate what additonal mass is possible.
They can do so after clicking 'Merge data to input file' where they will be asked if their MS data contains an additional mass (screenshot below).
Software screenshots are marked in grey boxes.
GlycanAnalyzer's output has two features that help users to accept or reject the assignments.
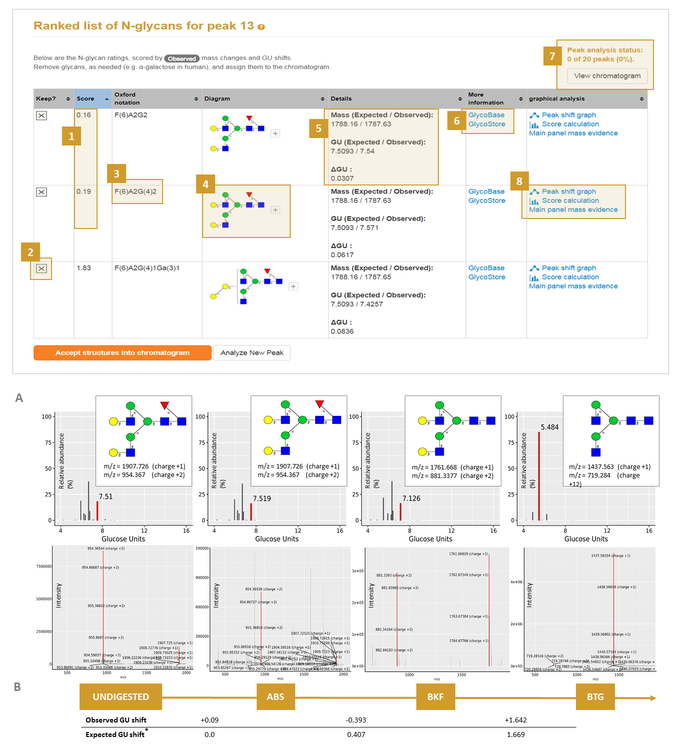
How both mass and GU shifts contribute to the score at each stage of the exoglycosidase array can be accessed in the 'score calculation' link (8A above). Assignments can be rejected by the user, for example the α-galactose structure can be rejected (2A above) as it is ranked quite badly as seen by its high score.
Links to databases GlycoStore and GlyTouCan (Aoki-Kinoshita, et al., 2016 are also available to direct the user to further information for the assignment (6A above).
The output is graphical in nature with each N-glycan shown in established CFG/Oxford diagram form (4A above). The shifting peaks can be visualized as a directed graph (in 'peak shift graph' 8A).
Other graphical outputs include the highlighted shifting UPLC peak with corresponding mass spectra, both highlighted in red, with glycan signals annotated (5B above).
When we are finished rejecting candidates and are happy with the current set of candidates we can click the 'Accept structures into chromatogram' button. In this case the completed peaks will be updated (7A in screenshot above). Then, clicking 'View chromatogram' button (7A above) will bring the user to the summary page.
Tip 7: Sometime no shifts can be found in this case there will be no 'Peak shft graph' or 'Score calculation' information.
Software screenshots are marked in grey boxes.
This presents a directed graph showing the estimated peak movement.
The size of a circle is proportional to the area of the peak.
Clicking the circles reveals the glycan structure assigned to the peak
in each digestion profile. An example with digested glycans is shown below:
Software screenshots are marked in grey boxes.
This is perhaps the most important information revealed by GlycanAnalyzer (see image below). It reveals the following pieces of information:
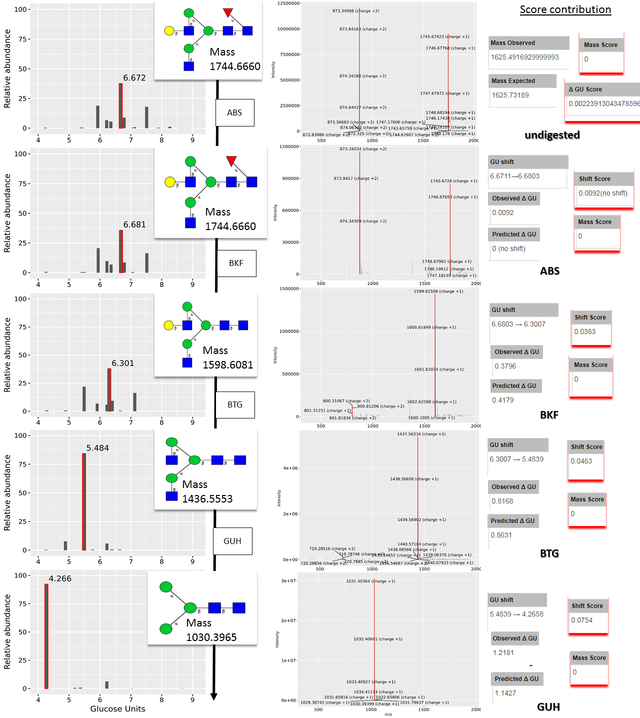
The screenshot above shows a score calculation for an example peak.
The total score is 0.1714 and it is calculated from the following columns with the headings titled:
Software screenshots are marked in grey boxes.
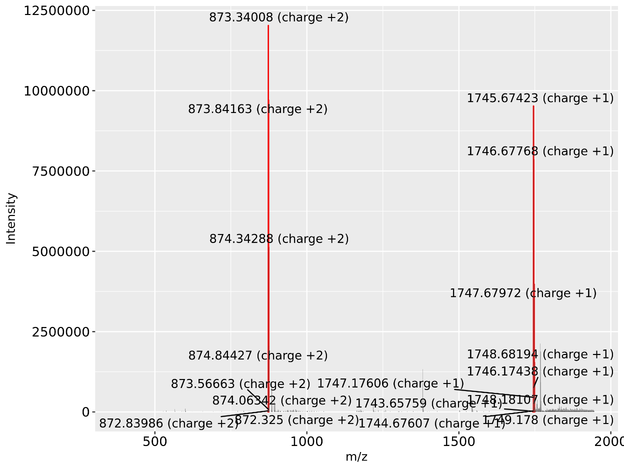
This is simply the mass spectra of the N-glycan(s) which were assigned to the current peak.
An example is provided below where the red bar indicates possible m/z for the N-glycan in all charge states (proton charges in this case).
Mass spectra images are derived from the input supplied by the user when the supply data through the 'merging 3D mass and peak information' button.
Software screenshots are marked in grey boxes.
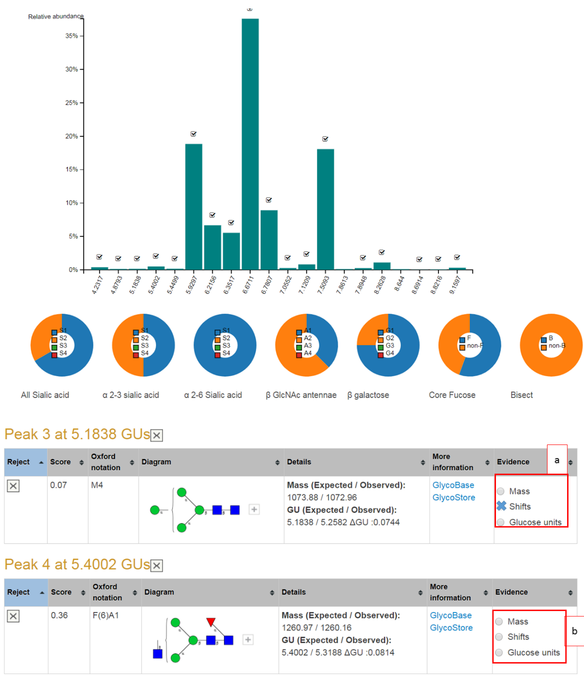
This page summarizes all the peak assignments accepted by the user thus far. The user still has the option to reject the assignments in this page.
An example screenshot of a completed N-glycan assignment to a monoclonal antibody is shown in the screenshot below. The bar chart shows each peaks relative abundance where a tick indicates user acceptance of the peak. Each bar can be clicked to reveal the peak shifting output. The pie charts give the distribution of sialic acids, GlcNAc antennae, galactose and other monosaccharides among others.
The tables present the N-glycans already assigned in the user accepted peaks. GlycanAnalyzer does not use threshold values to assign confidence levels to its annotations. Instead, three confidence levels for each glycan annotation is defined as follows:
An example summary page is shown below. Part (a) shows that peak 3 has two pieces of evidence an observed mass and similar GU to average evidence in public databases. Part (b) shows that peak 4 has three pieces of evidence: mass, shifting peaks and similar GU to database GU values. Peak 4's N-glycan assignment can be considered to have high confidence while peak 3's has medium confidence. The weakest level of supporting evidence is GU similarity alone.
Clicking on the button 'Mass' returns the mass spectrum for this peak and possible annotated m/z peaks for the current glycan. Clicking on the 'Shifts' radio button returns the score calculation and all possible UPLC and MS peak shifts. The 'Glucose unit' radio button can be clicked to visualize the GU evidence in glycostore.